and press [ OK ]
The next window pops up, select sam_data.sam and open the file.
Note: If the batchmode is just writing the .sam file at the moment you try to open it , SAM_view and SAM_log will crash. Wait for an update, than load sam_data.sam.
To prevent the crash you can also stop the batchmode during the correctionperiod. (Sam_log keeps running ! )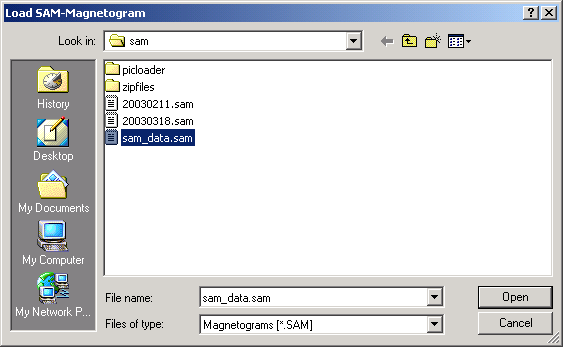
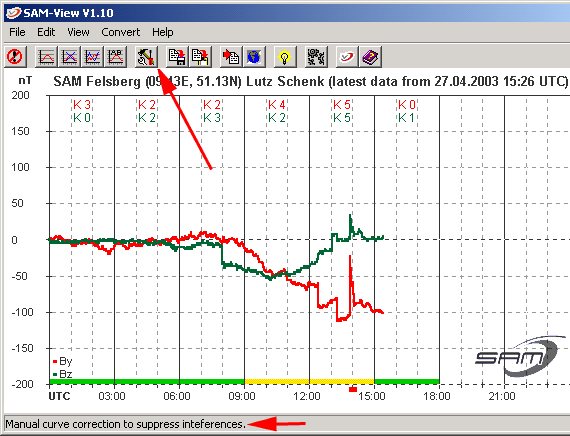
The latest diagram has been loaded and you can open the correction menu with the button [ Manual curve correction ].
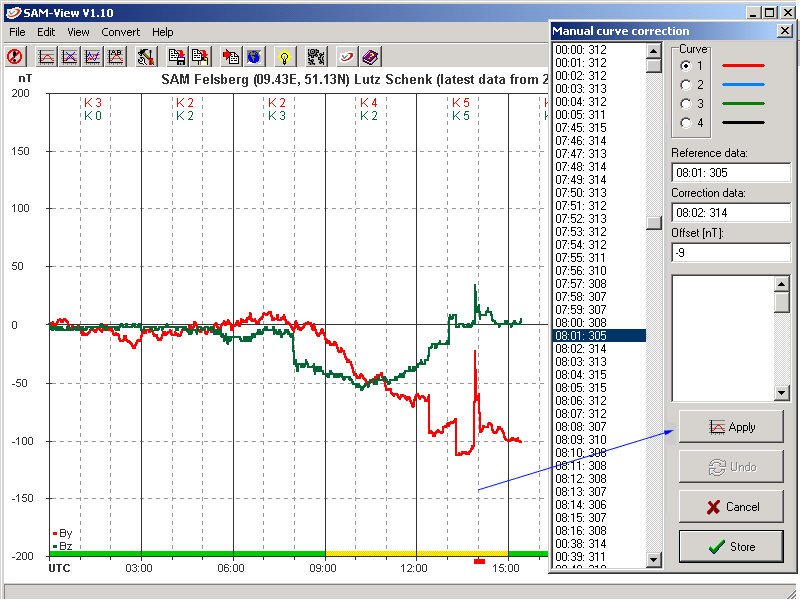
In the next window you see the disturbances marked with blue arrows and the correcionmenu to the right. For the easiest recognition of errors it is advisable the use you whole screen.
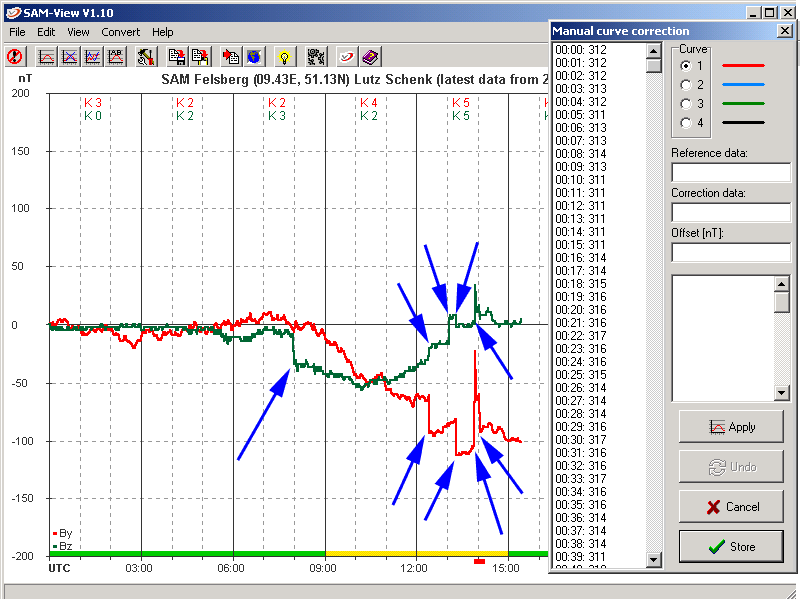
We start with the error around 08 UTC. This one is clearly visable in Z (green line) but also weakly in Y (red line).
To recognise the smaller disturbances you have to know your surroundings and some experience is needed too. After a while you can easily see the problems and correct them. Therefore, if you just build the kit and the sensor is still indoors, let the system run and experience what disturbances look like and correct them as much as you can.
The experience also learned us the a 10 sec das Log-Intervall (SAM_log) is the best rate to detect errors.
In the corrction menu we first select the curve we want to adjust (in this case curve 1).
We move the cursor to the place where the error occured. As soon as the cursor comes ober the curve it changes from an arrow into a cross.(1)
Do a right-mouse-click on the place of the error. In the correction window the place you indicated is highlighted in blue.(2) ( This Method is not that exact so the disturbance may actually be a few lines earlier or later than highlighted )
In this example the marker jumps to 08:00 UTC. The real error is at 08:02 UTC .( Difference between 08:01 und 08:02 = 9nT )
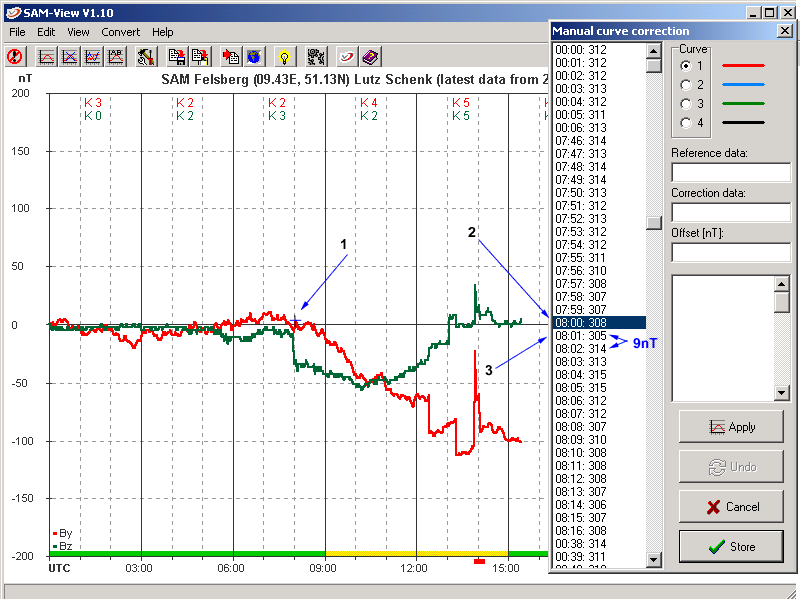
The values at "Referencedata", "Correction data" and "Offset" are still empty.
This changes by:
Clicking with the left-mouse-click on the value before the error (08:01: 305).
It sets this value in "Reference data", the next line as "Correction data ", and calculates the offset and sets it in the "Offset" field.
Because the second value is higher than the first the correction is a negative value.
Now we can confirm the correction with [ Apply ].
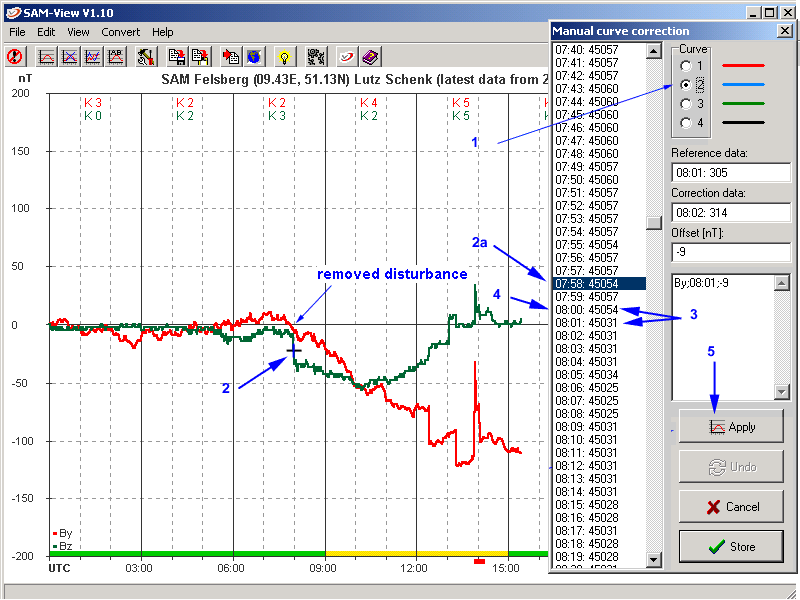
The correction is now made and the error is not visable anymore. ( removed disturbance )
If you you make a wrong correction simply [ Undo ]
This only works for the last correction you made , changes made before you cannot undo !
The only option if you made more mistakes is press [ Cancel ] and load the curve again
We start with the first error in Curve 2.
Select curve 2 in the correction window (1) and right-mouse-click on the error (in the graph). (2)
The highlighted line has to be checked first. (2a)
As you can see the error is 2 further lines lower (3) than the selected value.
Left-mouse-click on the correct line (4) and [ Apply ].
We correct all errors like this and a list of corrections will appear in the correction field (center right).
The correctionlist (1) and curve(s) schould now look like in the next picture.
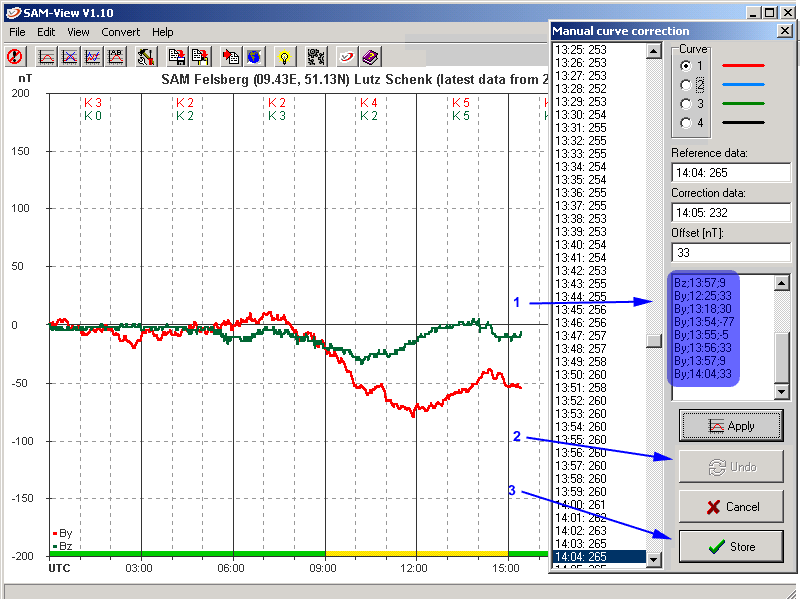
If all corrections are done they must be saved by pusing the [ Store ] button (3).
All corrections are now saved in a ".kor" file. This file can be opened with a text editor and incorrect corrections can simply be removed.
SAM_log can use the correctiondata, but it has to be told to.
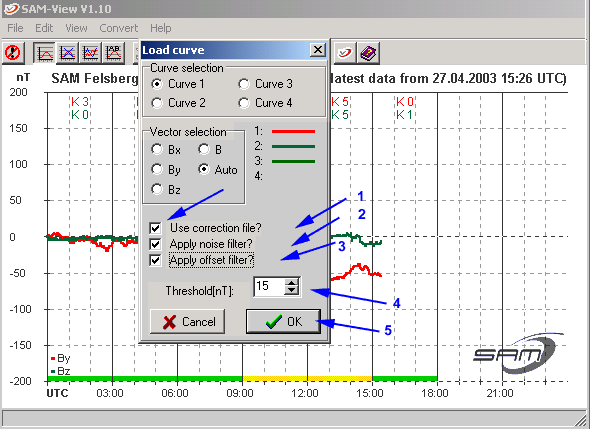
[ Load curve ] and set the following items: